User Manual
Inference Reports
mpVision allows you to run inference sessions and aggregates outputs into inference reports
Overview of Inference Reports
Inference reports are generated after running inference sessions on your trained models. They provide detailed information about the objects detected in the images and their corresponding labels.
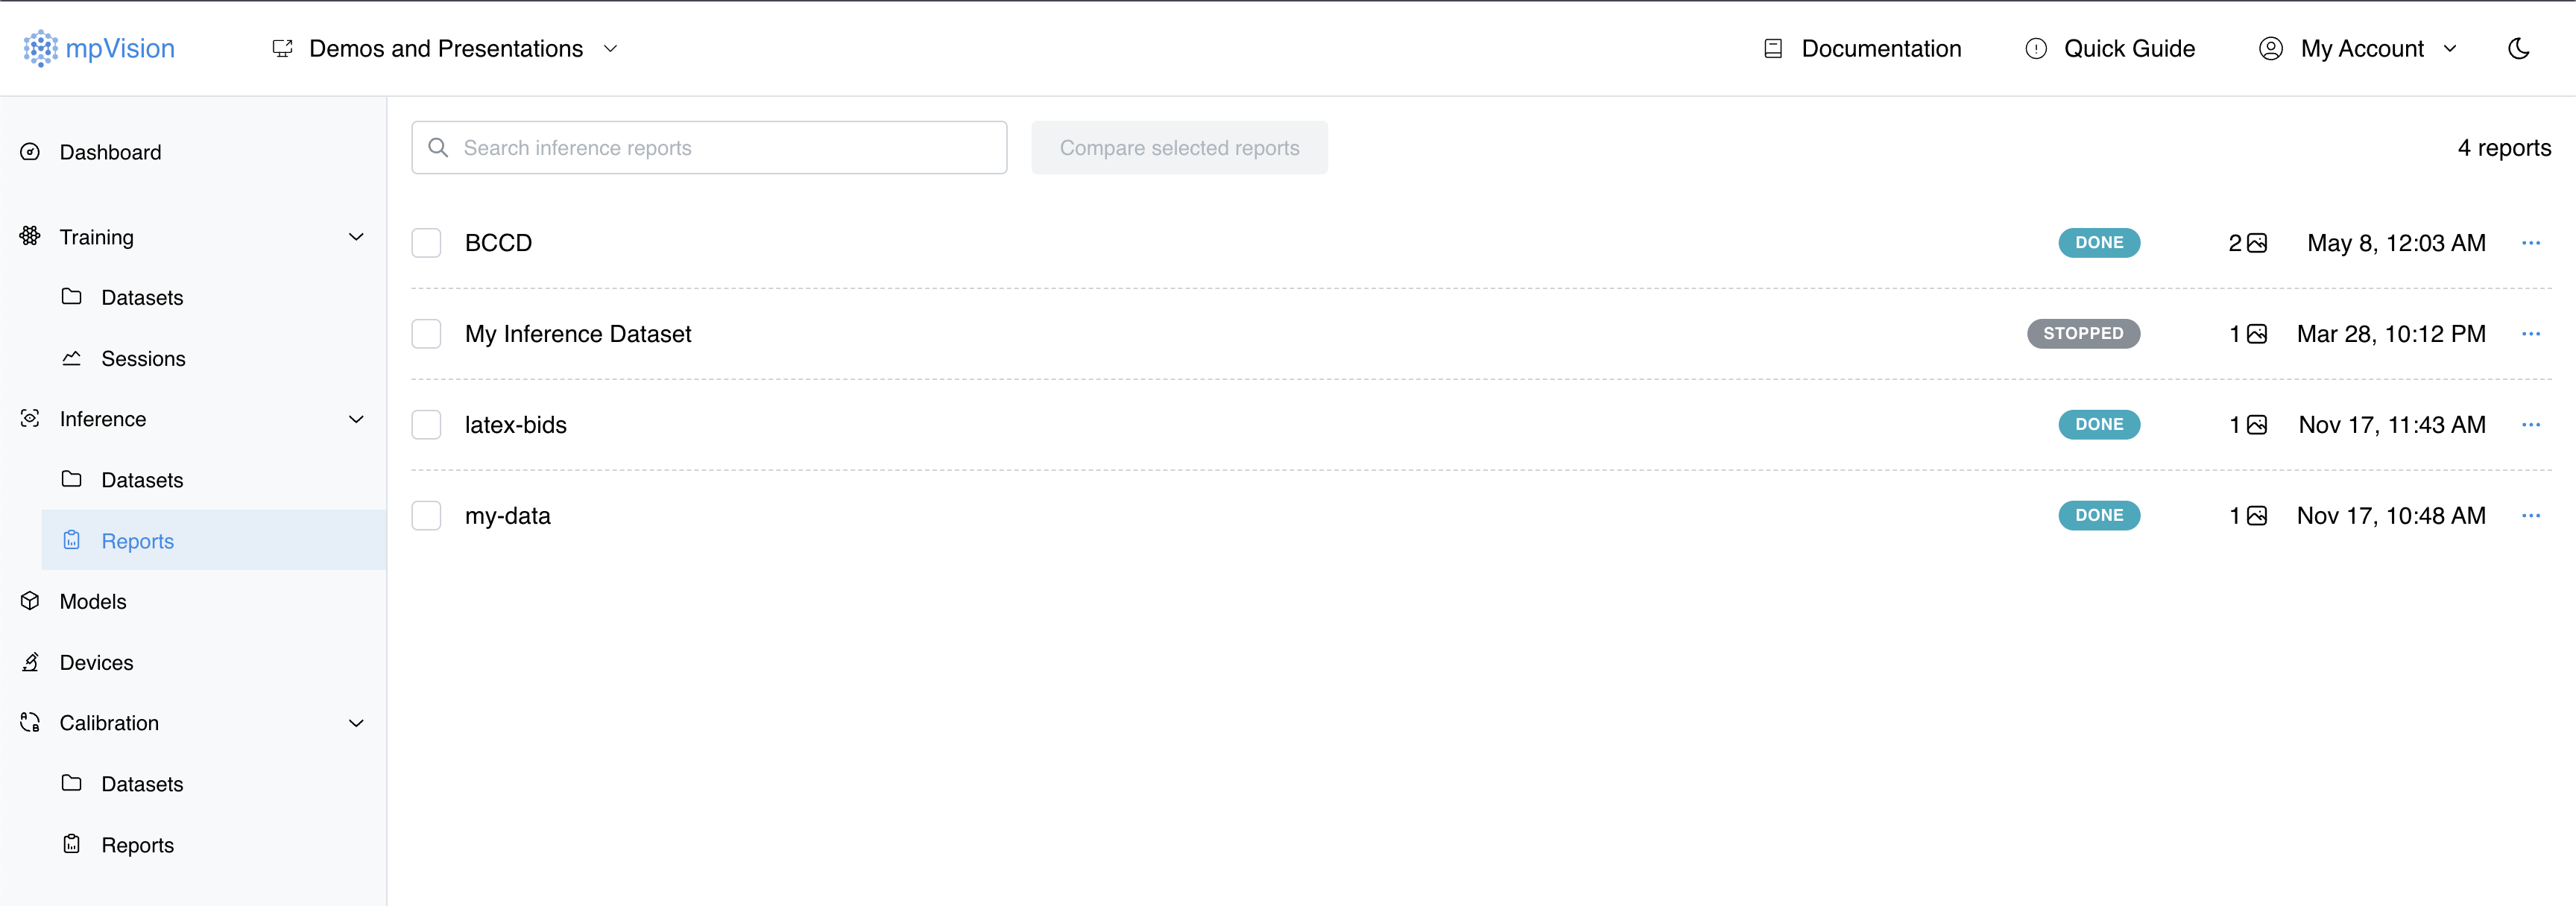
mpVision allows you to view and manage inference reports in the "Reports" section located under "Inference" session in the sidebar navigation menu.
Initiating an Inference Session
To run an inference session, follow these steps:
- Navigate to the inference datasets page located under the "Inference" section in the sidebar menu.
- Create/import a dataset: Click on the "+ Create / import dataset" button located near the top of the page. This will open the "Create new dataset" dialog.
- Upload images to the dataset using the file picker dialog or drag and drop images into the dropzone area.
- When images are uploaded, click on the "Start inference" button located in the top left corner of the inference datasets view.
- Select the model you want to use for inference from the dropdown list and click the "Start" button to begin the inference session.
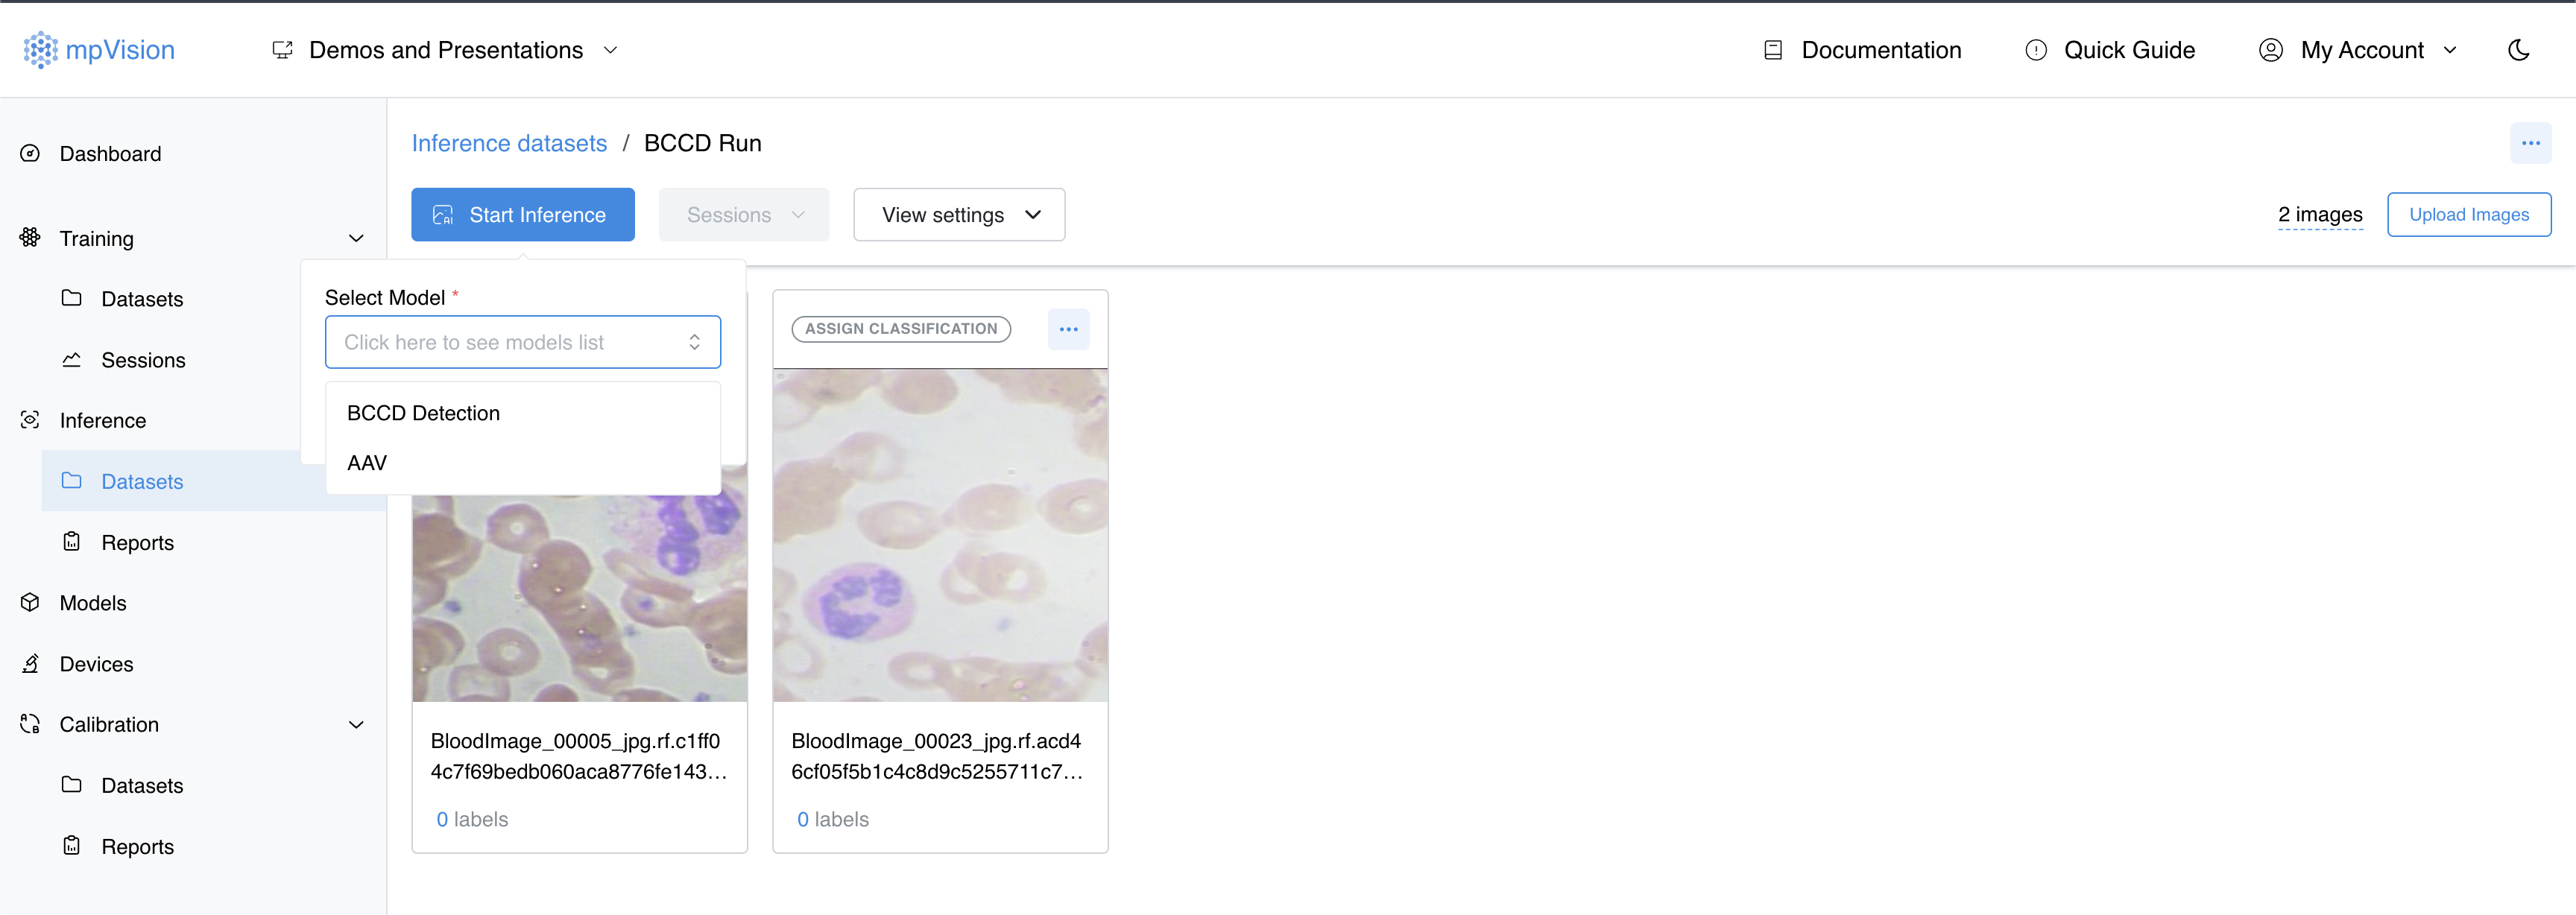
After the inference session is completed, you can view the inference report that shows the detected objects in the images and their corresponding labels.
Inference Report
To view the inference report, navigate to the "Reports" section located under the "Inference" session in the sidebar menu. Select the report title you want to preview by clicking on it from the inference reports list.
Understanding the Inference Report
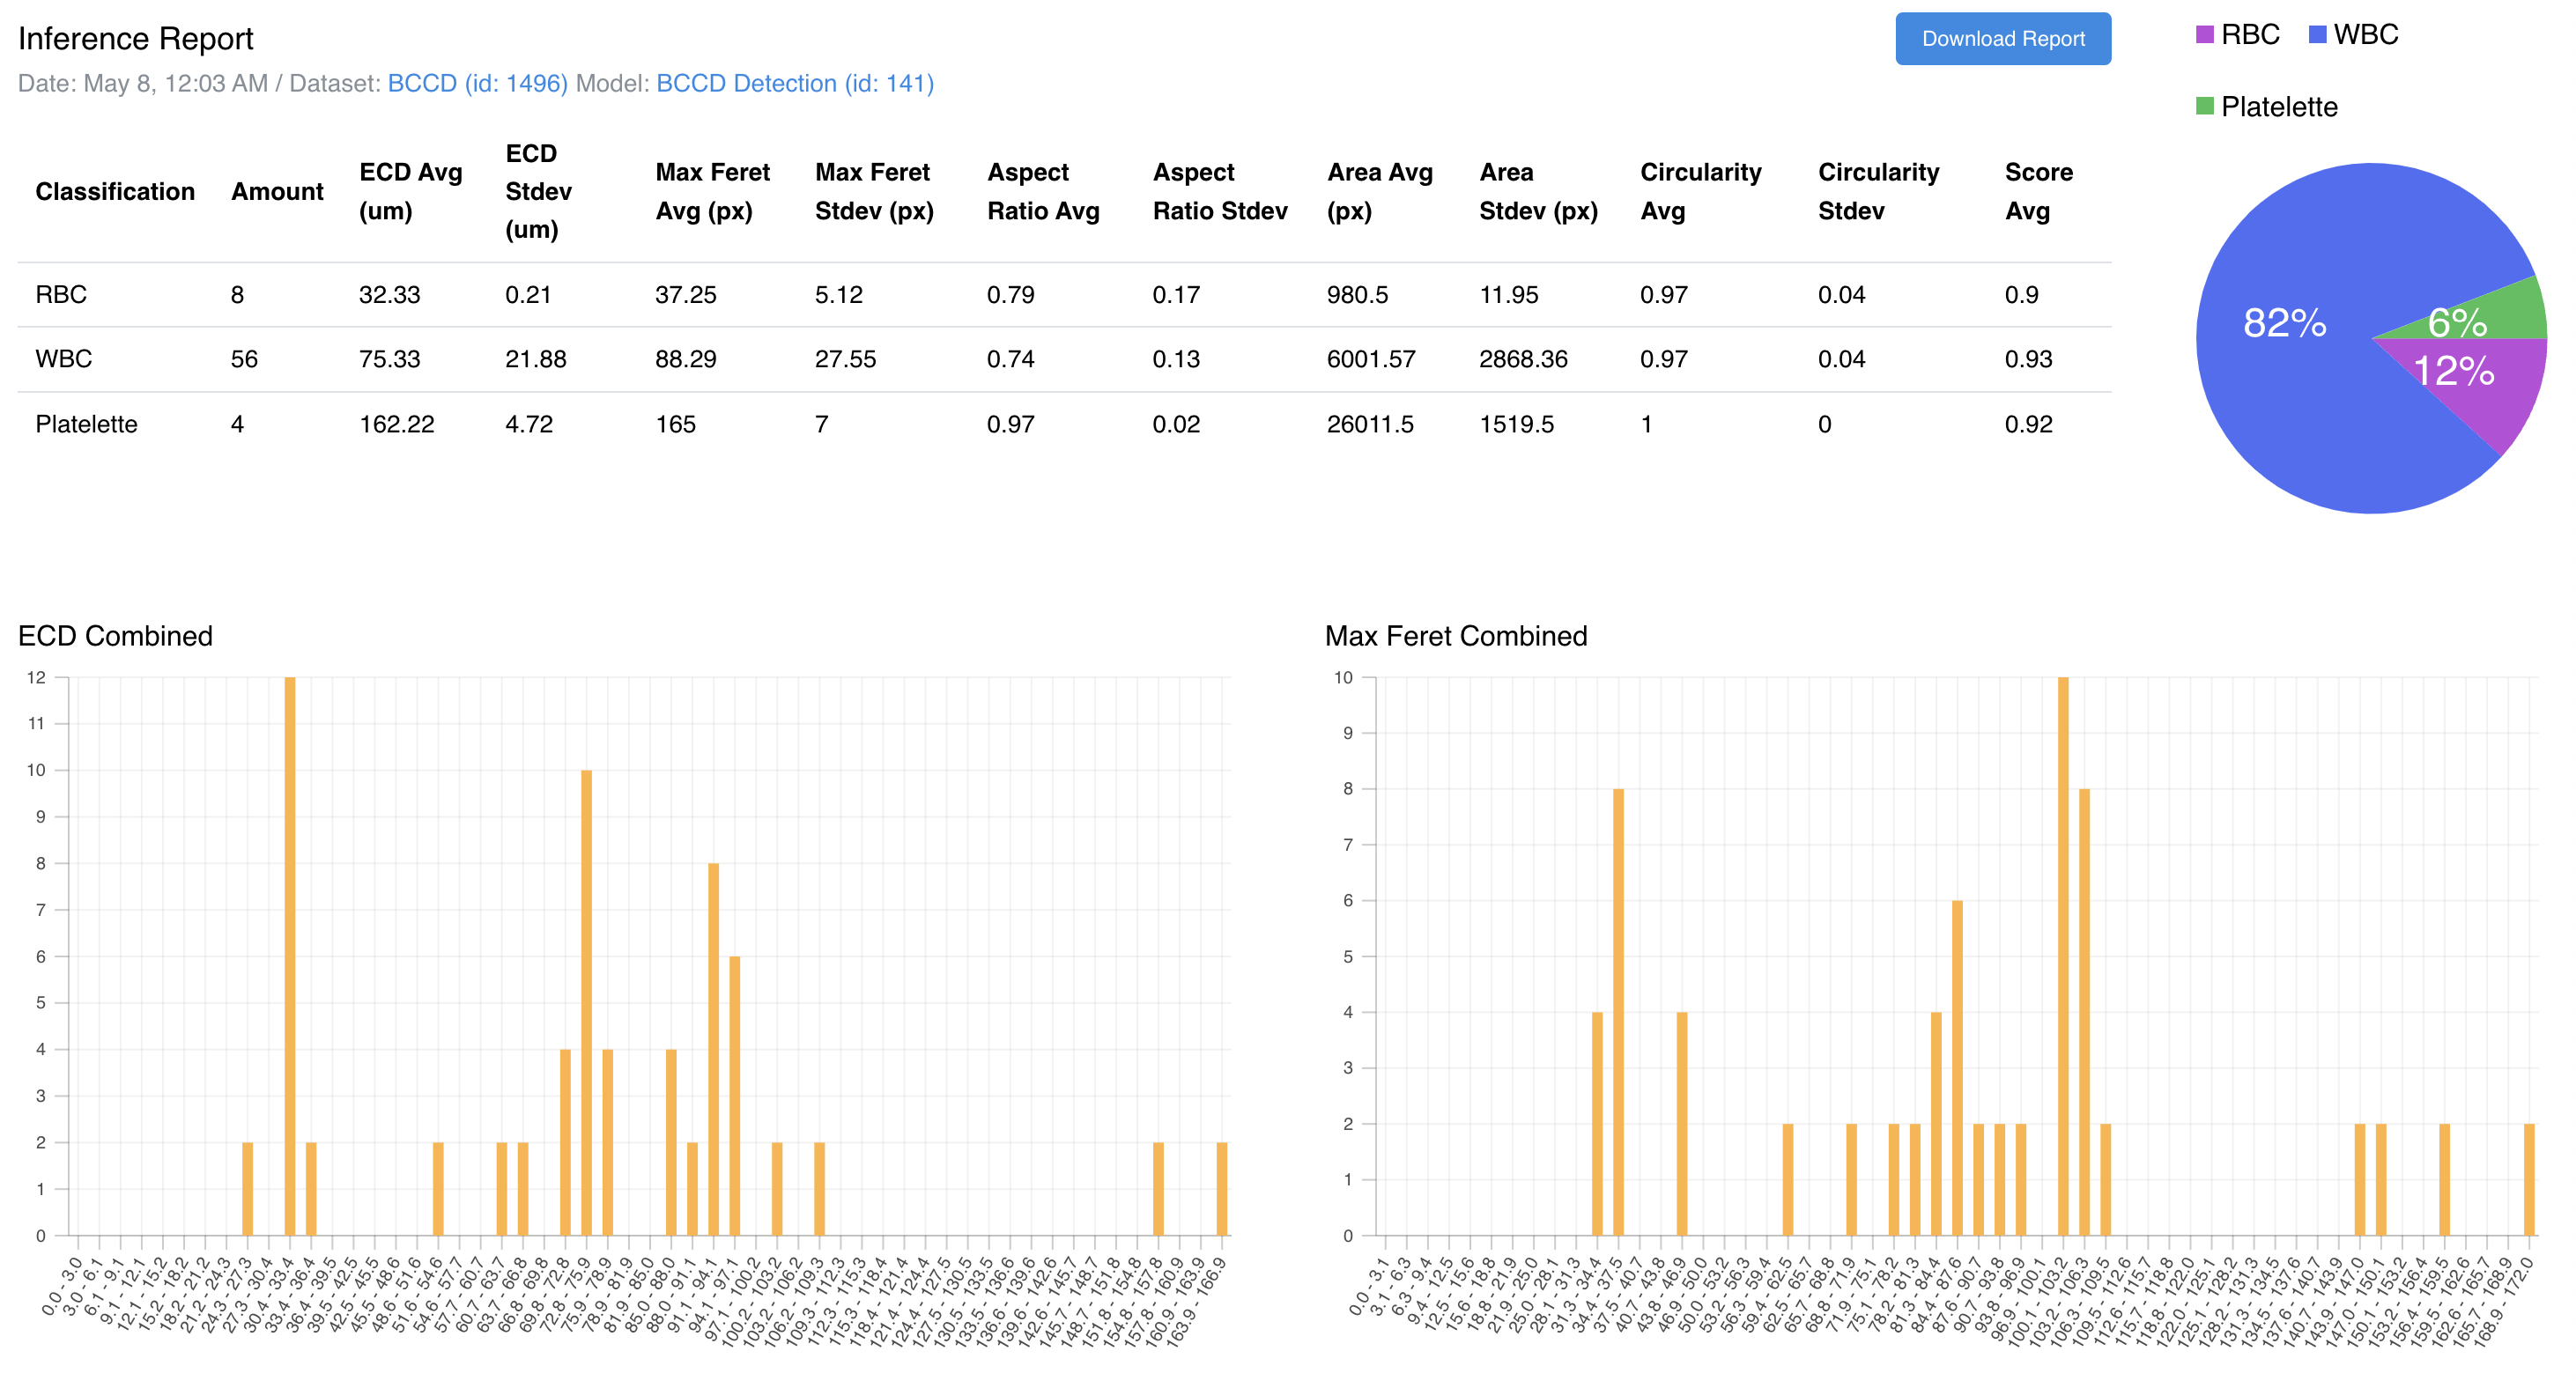
The report includes the following key metrics displayed as a table for each classification type:
- Amount: The number of detected objects per classification.
- ECD (Equivalent Circular Diameter) Avg and Stdev: Measures the average size and the standard deviation of detected objects, giving insights into the consistency of size detection across the dataset.
- Max Feret and Max Feret Stdev: The maximum diameter from side to side of a detected object, providing a sense of the largest dimension captured for each object, along with its variation.
- Aspect Ratio Avg and Stdev:: Shows the average aspect ratio (width to height) of detected objects and its variability, indicating shape uniformity.
- Area Avg and Stdev: Reflects the average area covered by detected objects and the spread of area sizes.
- Circularity Avg and Stdev: A measure of how close the shape of an object is to a perfect circle, useful for understanding shape accuracy.
- Score Avg: A numerical value indicating the confidence of the model in its classification accuracy for each detected object.
Visual data below the tables provides graphs and charts showing the distribution of key metrics across the dataset, helping you to quickly identify patterns and outliers in the data.
- ECD Combined: A histogram showing the distribution of the Equivalent Circular Diameter for all classifications combined.
- Max Feret Combined: Similar to the ECD, this histogram shows the distribution of the Max Feret dimension across all detected objects.
- ECD by Classifications and Max Feret by Classifications: These graphs break down the ECD and Max Feret measurements by each classification, providing a visual comparison of size dimensions across different object types.
Below the graphs, you can find a gallery of images with detected objects highlighted. This section provides a thumbnail preview of the images processed during the inference. Each entry includes detailed metrics such as size, ECD, area, max Feret, perimeter, and the score for each detected object. You can filter and sort these images based on labels or other criteria to better analyze specific cases.
Exporting Inference Reports
At the top of the report, you have the option to download the entire report. This feature is beneficial for deeper offline analysis or for preparing presentations and reports. Supported formats include PDF, CSV, and EXCEL.
Using the Report for Model Improvement
These detailed metrics and visual tools are essential for evaluating the model’s performance and can be used to fine-tune the model. By analyzing areas where the model may show inconsistencies in detection or measurement (e.g., high variability in aspect ratio or circularity), it is possible to do informed adjustments to the model parameters or even consider retraining the model with augmented datasets to improve accuracy and performance.
To export the report images with detected objects as labels for a training dataset click on the "Export to dataset" button located in the top right corner of the inference images list
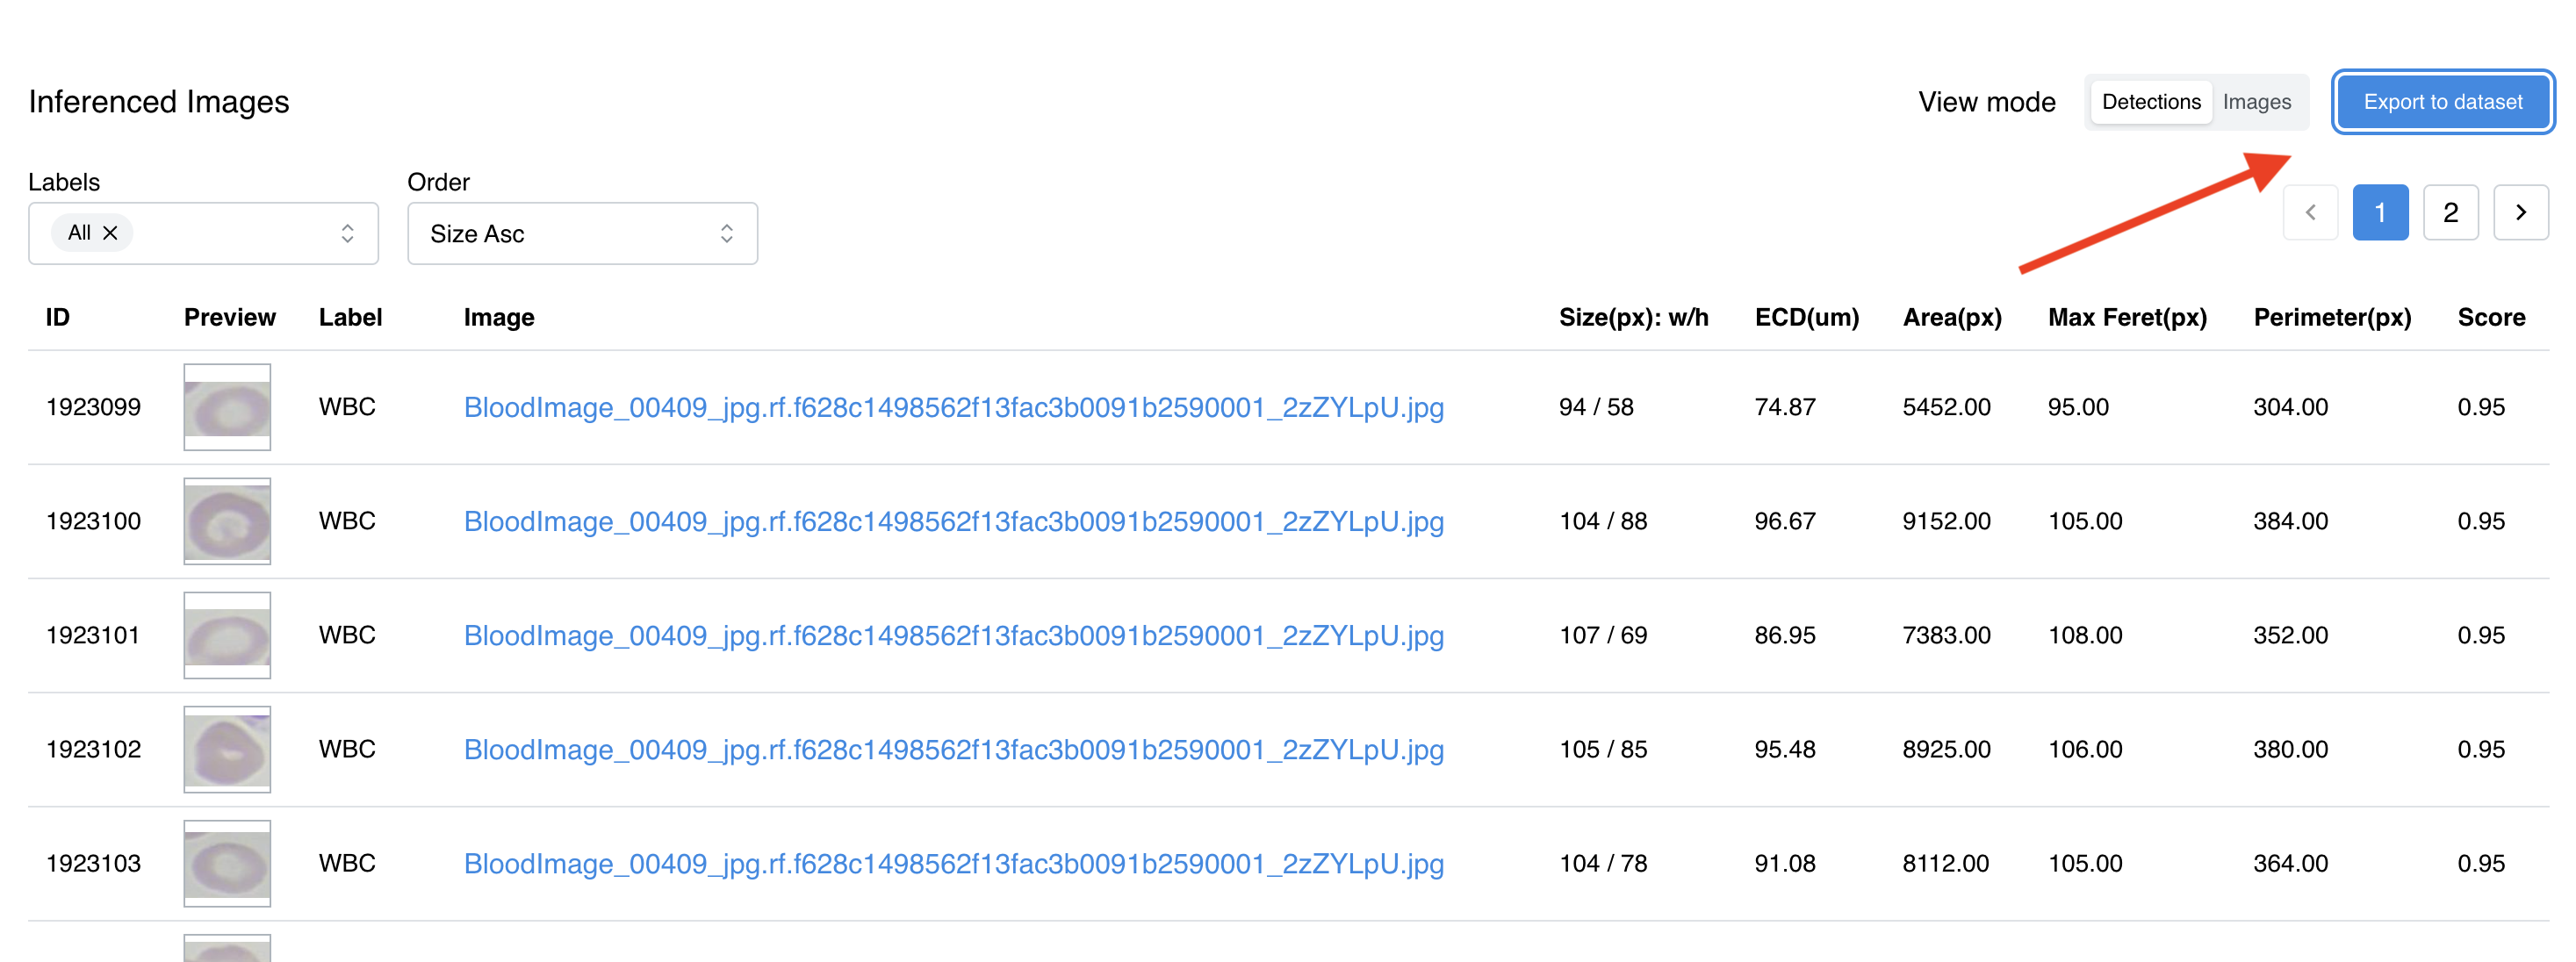
In the dialog that opens, select the dataset you want to export the images to (or create a new dataset by typing its name) and click the "Export" button to start the export process.

After the export is completed, you can navigate to the datasets page to view the exported images in the selected dataset.
Archiving Inference Reports
Archiving inference reports is a useful feature to keep your workspace organized and decluttered. To archive an inference report, click on the "Archive" button located in the top right corner of the report list item.
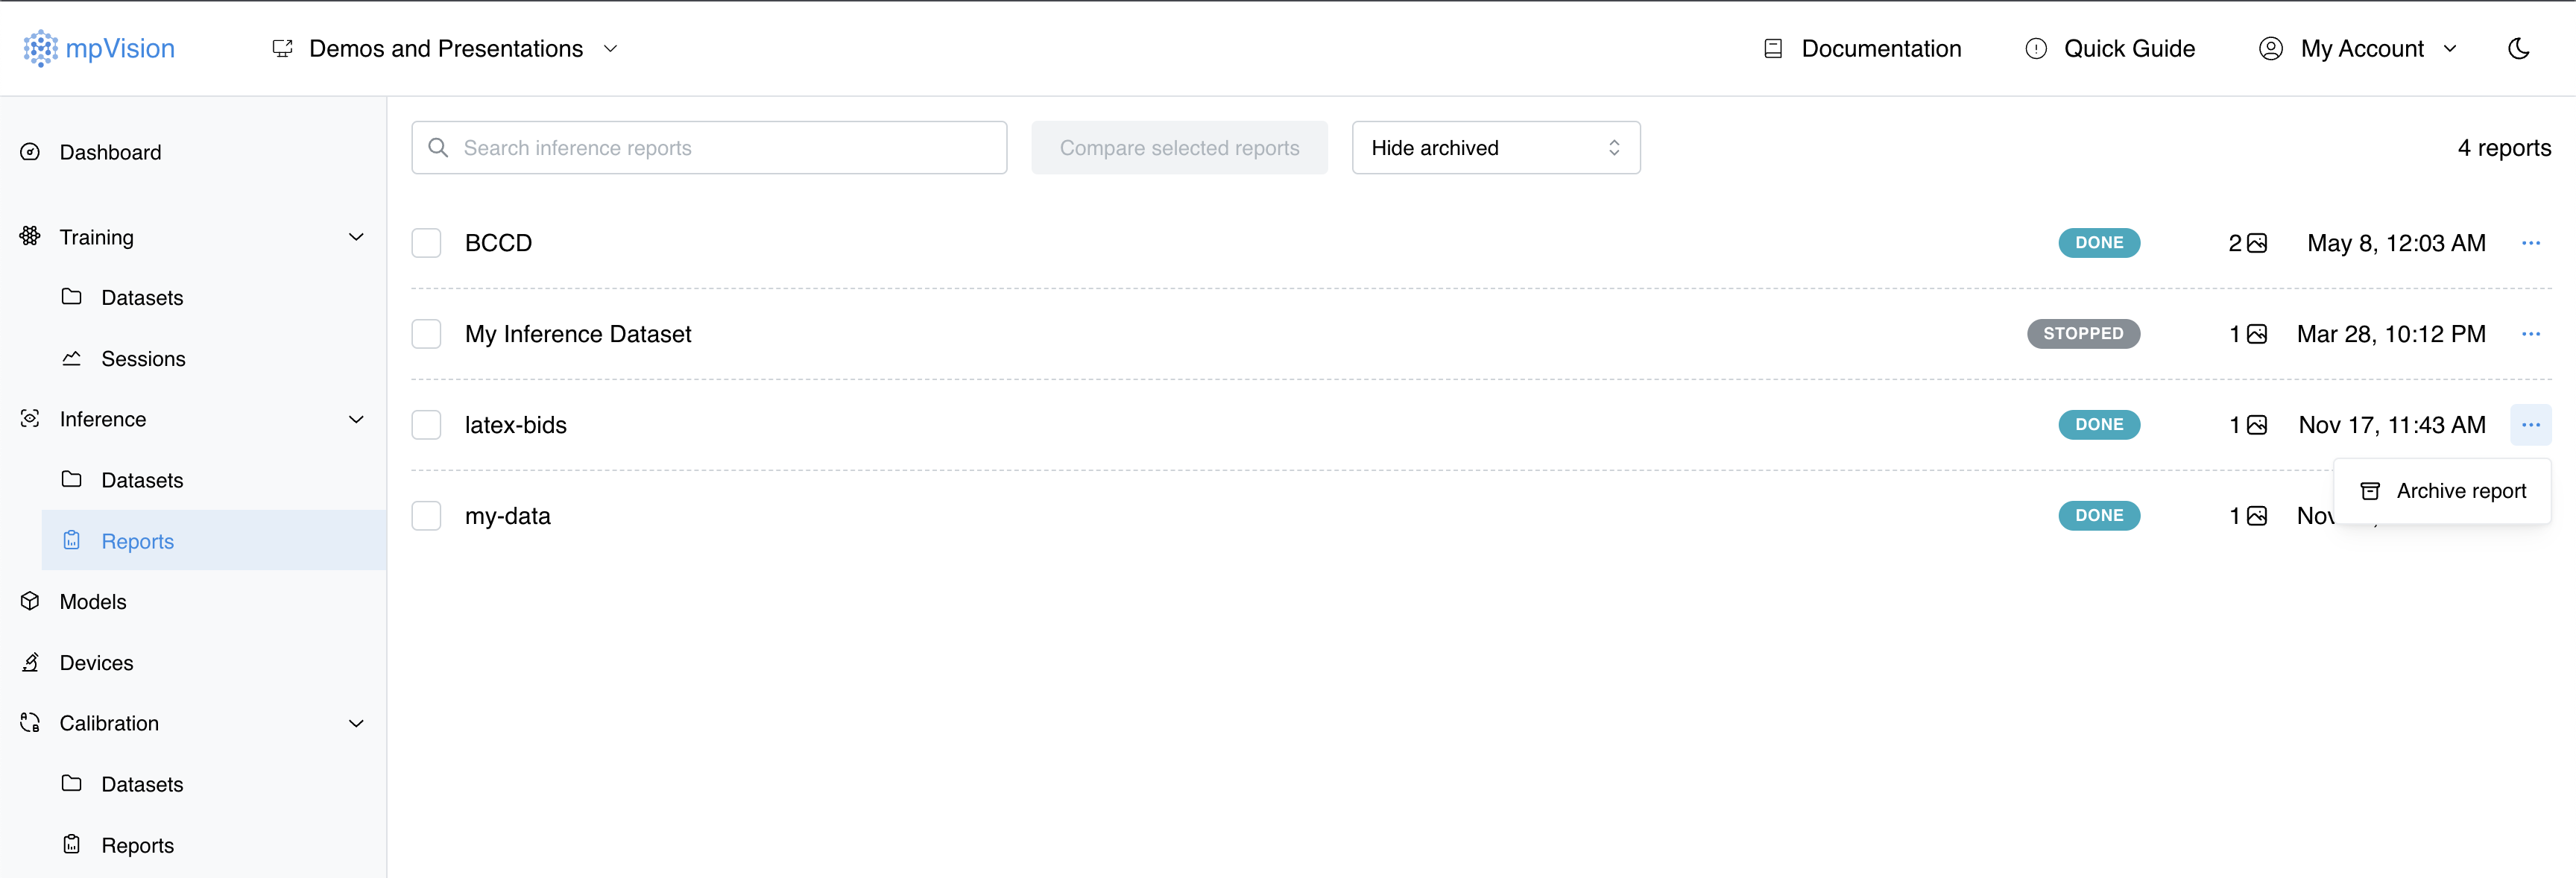
Archived reports are moved to the archived list and can be accessed by selecting "Show archived" from the dropdown menu located at the top of the reports list.

If a report added to the archive by a mistake or you need to restore it, click on the "Remove from archive" button located in the top right corner of the archived report list item. It will be added back to the main reports list.